Tukey Hinges Quartile Calculator
The standard textbook method for calculating quartiles and box plots. Perfect for statistics students and manual calculation verification.
How to use Tukey's Method
Enter Dataset
Tukey Selected
Get Hinges
Supported Data Formats:
- Comma-separated: 1.5, 2.8, 9.1, 16.2
- Space-separated: 1.5 2.8 9.1 16.2
- Newline-separated: one number per line
- Scientific notation: 1.23e-4, 5.67E+8
- Series mode: use "Group Name: value1, value2, value3" per line to compare multiple groups
- Automatically ignores text and special characters
Universal Standard (R, Python, Google Sheets)
Linear interpolation method, default standard for modern data science software
Your calculation results and box plot will appear here instantly
Please enter at least 4 numbers above to start calculating
Calculation Results
Basic Statistics
Quartiles
5 Number Summary
Outliers Detected
The following data points are identified as outliers using the method:
Grouped Series Summary
Enter data to generate box plot
Please enter at least 4 numbers above to start calculating
Box Plot Visualization
This box plot visualizes your data distribution. The box shows the interquartile range (IQR) containing the middle 50% of data. The line inside the box represents the median. Whiskers extend to show the range, and red dots indicate outliers.
Outlier Method: Tukey (1.5×IQR)
Box (IQR) / Legend
- Box (IQR)
- Median Line
- Whisker
- Outliers
Combined Summary
Master Quartiles
What is the Tukey Hinges Method?
Tukey's Hinges is a specific method for calculating quartiles (Q1 and Q3) developed by the legendary statistician John Tukey. It is widely used in introductory statistics textbooks and is the standard method for constructing box plots by hand.
How Tukey's Method Works
Unlike the linear interpolation methods used by modern software like R (Type 7) or Python's NumPy, Tukey's method is based on the concept of "hinges" which are essentially the medians of the lower and upper halves of the data.
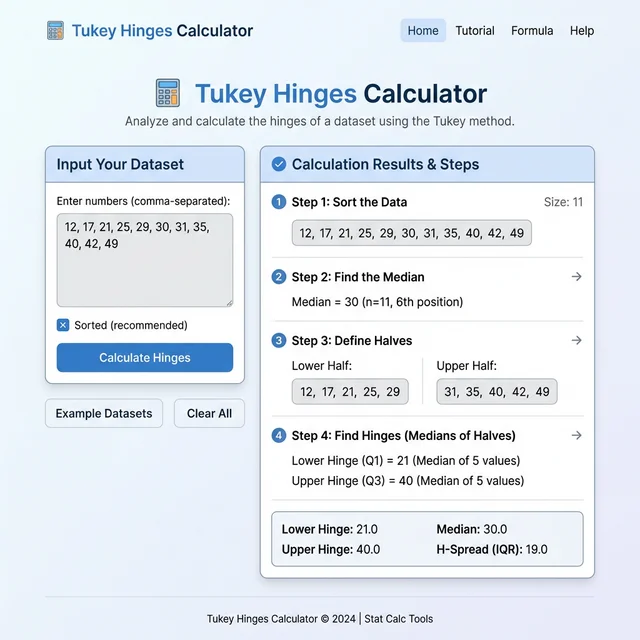
- Sort the Data: Arrange the dataset in ascending order.
- Find the Median: Split the data into two halves at the median.
- Inclusive vs. Exclusive:
- If the dataset has an odd number of values, the median is included in both the lower and upper halves (Inclusive Method).
- If the dataset has an even number of values, the dataset is split cleanly down the middle.
- Calculate Hinges:
- Lower Hinge (Q1): The median of the lower half.
- Upper Hinge (Q3): The median of the upper half.
Why do my results differ from Excel or R?
This is the most common source of confusion for statistics students.
- Excel (QUARTILE.EXC) uses an (N+1) interpolation method, which often produces results that are further from the median.
- R and Python (Default) use Linear Interpolation (Type 7), which is mathematically more rigorous for continuous distributions but harder to calculate by hand.
- Tukey's Hinges are designed for exploratory data analysis (EDA) and manual calculation. If your textbook asks you to "find the median of the lower half," you should use this Tukey calculator.
PlotNerd's Tukey Hinges Calculator is specifically programmed to match this textbook logic, ensuring you get the correct answer for your homework or manual verification needs.
When to Use This Tool
Statistics Homework
Perfect when your textbook asks you to "find the median of the lower half" or use the inclusive method.
Manual Calculation Verification
Verify your hand-calculated quartiles against Tukey's method before submitting assignments.
Pre-2000s Textbook Examples
Most introductory statistics textbooks published before 2000 use this exact method.
Not Recommended: Production Data Science
For R/Python projects, use Type 7 (excel_inclusive) for better software compatibility.
Related Tools & Resources
Excel Quartile Calculator
Compare Tukey vs Excel QUARTILE.INC results
→ Compare methods5 Number Summary
Get Min, Q1, Median, Q3, Max in one click
→ Get 5 numbersIQR Calculator
Calculate IQR and detect outliers with Tukey method
→ Find outliersUltimate Guide to Quartile Algorithms
Deep dive into Type 6 (Tukey Hinges) algorithm
→ Read deep diveAlgorithm Comparison
Side-by-side comparison of 4 quartile methods
→ View comparisonUniversal Calculator
Try all 4 quartile algorithms with your data
→ Try all methodsFrequently Asked Questions
Statistical concepts explained in plain language
Mathematical Formulas
View the standard mathematical formulas behind the calculations
Quartile Calculation (Method 2)
First Quartile (Q1):
Median (Q2):
Third Quartile (Q3):
Interquartile Range & Outlier Detection
Interquartile Range (IQR):
Outlier Boundaries:
Algorithm Explanation
PlotNerd uses the statistically standard "Method 2 (Median Quartile Method)" for quartile calculations, consistent with major statistical software (such as R, SPSS). All calculation results are verified against authoritative platforms to ensure accuracy.