Central Tendency
Nov 13, 2025
Mean vs Median vs Mode: When Each Wins
Learn decision frameworks for choosing the right measure of central tendency. Includes real-world examples, outlier handling, and PlotNerd workflows.
14 min read
Read Article
Support for Tukey, Excel, R, and Python algorithms. 100% client-side computing ensures complete data privacy.
| Feature | PlotNerd | Excel | GraphPad |
|---|---|---|---|
| Cost | Free | $160/yr | $600/yr |
| Algorithms | 4 (Toggle) | 1 (Hidden) | 1 (Default) |
| Outlier Detection | IQR + MAD | Manual | ROUT |
The textbook-standard method for calculating quartiles. Perfect for homework and manual verification.
Try Calculator →Calculate quartiles using Excel's QUARTILE.INC method. Verify your spreadsheet results instantly.
Try Calculator →Calculate the Interquartile Range (IQR) and detect outliers using the 1.5×IQR rule.
Try Calculator →Get the complete Min, Q1, Median, Q3, Max summary for your dataset in one click.
Try Calculator →Calculate any percentile (25th, 50th, 75th, 90th, 95th, 99th) for test scores and benchmarking.
Try Calculator →Calculate sample and population standard deviation, variance, and more. Privacy-focused computation.
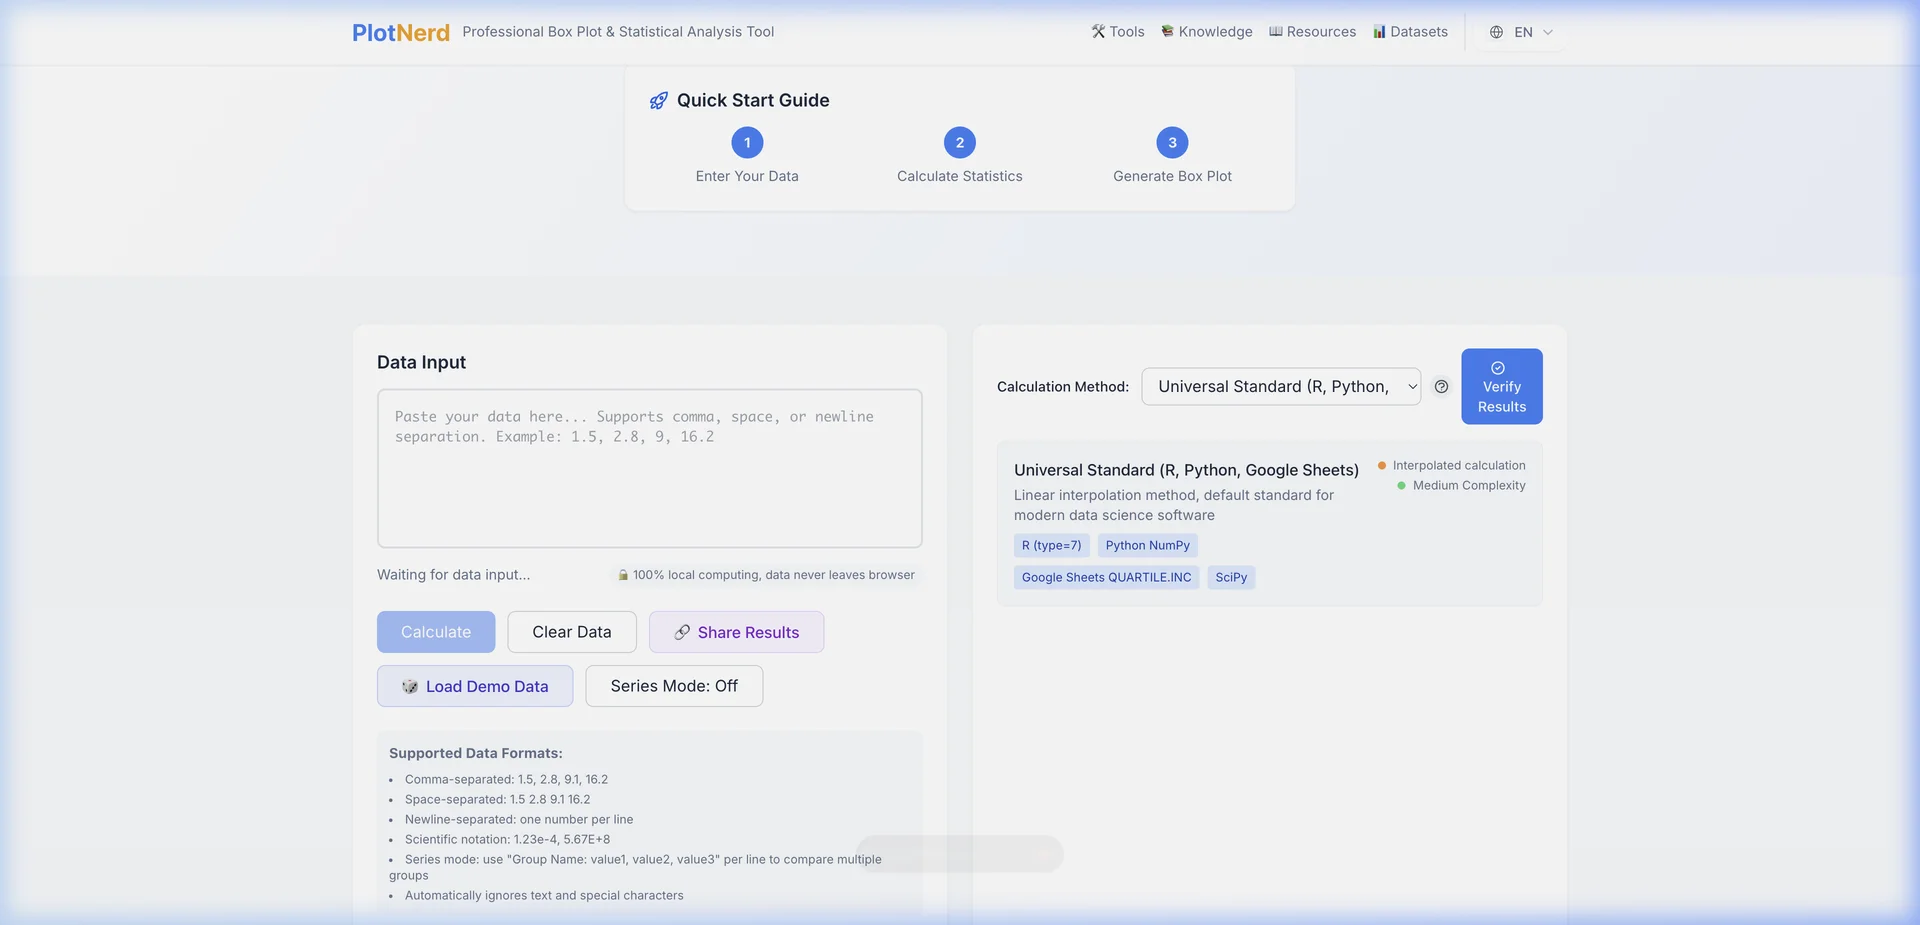
Try Calculator →Enter Your Data
Calculate Statistics
Generate Box Plot
Supported Data Formats:
Linear interpolation method, default standard for modern data science software
Please enter at least 4 numbers above to start calculating
The following data points are identified as outliers using the method:
Please enter at least 4 numbers above to start calculating
This box plot visualizes your data distribution. The box shows the interquartile range (IQR) containing the middle 50% of data. The line inside the box represents the median. Whiskers extend to show the range, and red dots indicate outliers.
Outlier Method: Tukey (1.5×IQR)
Master quartiles with this comprehensive 2500-word guide. Learn calculation methods, real-world applications, and expert tips.
Read Guide →Why do your results differ? We analyze Hyndman-Fan Types 6, 7, and 8 with code examples for developers.
Read Analysis →Understand the key differences, relationships, and when to use each measure for your data analysis.
Learn More →Industry-standard Tukey methods, compatible with major statistical software, featuring WolframAlpha cross-verification
100% client-side computing ensures your data never leaves your browser, completely local processing, secure and reliable
Real-time input parsing, instant result generation, supports large datasets, no server response delays
Multiple data format support, intelligent parsing, one-click copy results, designed for students and researchers
High-quality SVG box plots, outlier detection, supports PNG/SVG export, perfect for academic and business use
No registration required, no usage limits, forever free, open and transparent, continuous improvement and maintenance
Explore tutorials and analysis explainers written by the PlotNerd team. Each article pairs hands-on walkthroughs with direct links back to the calculator.
Learn decision frameworks for choosing the right measure of central tendency. Includes real-world examples, outlier handling, and PlotNerd workflows.
Decode every element of box-and-whisker charts, follow a classroom case study, and learn how PlotNerd flags outliers instantly.
See where the two most common quartile algorithms diverge, walk through real datasets, and standardize your reporting workflow with PlotNerd toggles.
Statistical concepts explained in plain language
View the standard mathematical formulas behind the calculations
Algorithm Explanation
PlotNerd uses the statistically standard "Method 2 (Median Quartile Method)" for quartile calculations, consistent with major statistical software (such as R, SPSS). All calculation results are verified against authoritative platforms to ensure accuracy.
No software download needed, no account registration required, use the professional quartile calculator instantly