Interquartile Range (IQR) Calculator
Instantly calculate the IQR (Q3 - Q1) and identify outliers. The fastest way to measure statistical dispersion.
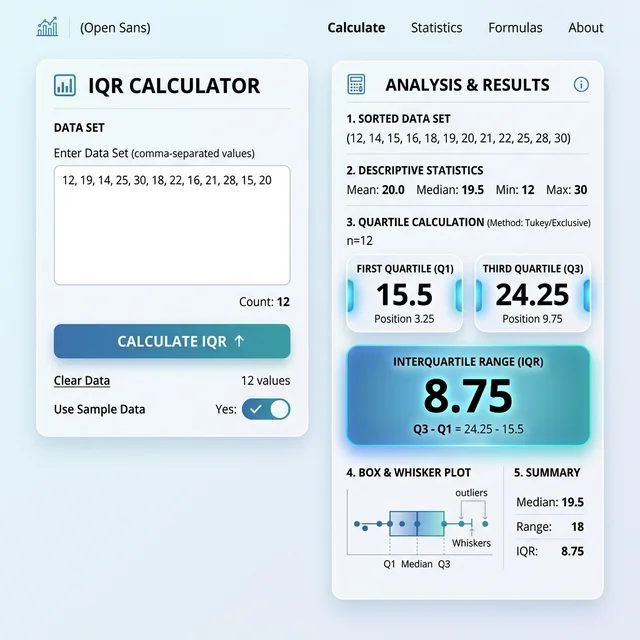
Calculate IQR in 3 Steps
Enter Numbers
Auto-Calculate
See IQR & Outliers
Supported Data Formats:
- Comma-separated: 1.5, 2.8, 9.1, 16.2
- Space-separated: 1.5 2.8 9.1 16.2
- Newline-separated: one number per line
- Scientific notation: 1.23e-4, 5.67E+8
- Series mode: use "Group Name: value1, value2, value3" per line to compare multiple groups
- Automatically ignores text and special characters
Universal Standard (R, Python, Google Sheets)
Linear interpolation method, default standard for modern data science software
Learn More About Distribution
What is the IQR Method?
The IQR Method (Interquartile Range Method) is a robust statistical technique used to measure the spread of data and detect outliers. Unlike the standard range (Max - Min), which is easily skewed by extreme values, the IQR method focuses on the middle 50% of your dataset.
It is calculated as the difference between the third quartile ($Q3$) and the first quartile ($Q1$):
IQR = Q3 - Q1
Why is IQR important?
The IQR is considered a robust statistic because it is resistant to outliers.
- Resistance to Skew: If you have one billionaire in a room of factory workers, the "Average" (Mean) income skyrockets, but the Median and IQR remain stable.
- Data Spread: A large IQR indicates the middle data points are spread far apart; a small IQR means they are clustered closely around the median.
Using IQR to Detect Outliers
The most common application of the IQR is the "1.5 x IQR Rule" for outlier detection, often attributed to John Tukey.
- Calculate the IQR ($Q3 - Q1$).
- Multiply the IQR by 1.5.
- Lower Fence: $Q1 - (1.5 \times IQR)$
- Upper Fence: $Q3 + (1.5 \times IQR)$
Any data point that falls below the Lower Fence or above the Upper Fence is considered a mild outlier. If you use a multiplier of 3.0 instead of 1.5, those points are considered extreme outliers.
PlotNerd's IQR Calculator makes it easy to detect outliers and measure data spread using the robust interquartile range method.
When to Use This Tool
Outlier Detection with 1.5×IQR Rule
Identify data points beyond Q1 - 1.5×IQR and Q3 + 1.5×IQR boundaries.
Measuring Data Spread (Robust to Extremes)
IQR is unaffected by outliers, making it ideal for skewed distributions.
Complement to Box Plot Visualization
Box plots use IQR to determine whisker length and outlier markers.
Not Ideal: Normally Distributed Data
For normal distributions, standard deviation is more appropriate than IQR.
Related Tools & Resources
5 Number Summary
IQR is part of the 5-number summary (Q3 - Q1)
→ Get 5-number summaryTukey Hinges Calculator
The 1.5×IQR Rule was invented by John Tukey
→ Use Tukey's methodExcel Quartile Calculator
Calculate IQR using Excel's QUARTILE.INC method
→ Use Excel methodComplete IQR Outlier Detection Guide
Deep dive into Tukey fences and robust outlier detection
→ Read guideMAD vs Tukey Comparison
Compare IQR method with MAD for outlier detection
→ Compare methodsUniversal Calculator
Calculate IQR using different quartile algorithms
→ Try all methodsFrequently Asked Questions
Statistical concepts explained in plain language
Mathematical Formulas
View the standard mathematical formulas behind the calculations
Quartile Calculation (Method 2)
First Quartile (Q1):
Median (Q2):
Third Quartile (Q3):
Interquartile Range & Outlier Detection
Interquartile Range (IQR):
Outlier Boundaries:
Algorithm Explanation
PlotNerd uses the statistically standard "Method 2 (Median Quartile Method)" for quartile calculations, consistent with major statistical software (such as R, SPSS). All calculation results are verified against authoritative platforms to ensure accuracy.