How to Read a Box Plot:
A Simple Guide for Students and Analysts
Box-and-whisker plots condense an entire distribution into five key numbers. This guide walks through every element so you can explain variability, spot outliers, and communicate insights with confidence.
Quick Answer: How to Read a Box Plot
A box plot (box-and-whisker plot) displays data distribution using 5 key values:
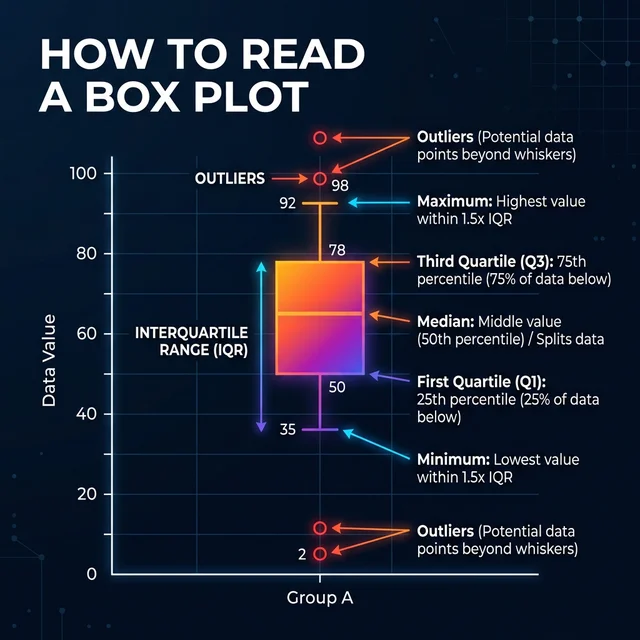
- Minimum — The lowest data point (or lower whisker)
- Q1 (25th percentile) — Bottom edge of the box
- Median (Q2, 50th percentile) — Line inside the box
- Q3 (75th percentile) — Top edge of the box
- Maximum — The highest data point (or upper whisker)
The box represents the middle 50% of data (IQR). Whiskers extend to show the data range. Dots beyond whiskers indicate outliers.
1. What a Box Plot Shows at a Glance
A box plot, also called a box-and-whisker chart, summarizes how data points are spread. It packages the minimum, first quartile (Q1), median (Q2), third quartile (Q3), and maximum into a single view so you can compare shapes and spot outliers quickly. Where a histogram demands dozens of bars, a box plot answers three questions immediately: Where is the middle? How wide is the spread? Are there unusual values?
Because quartiles divide your dataset into four equal parts, the length of the box reflects the interquartile range (IQR) — the heart of the distribution. Long whiskers hint at variability beyond the middle 50%, while dots outside the whiskers signal potential outliers worth investigating.
2. Visual Elements Explained One by One
Core Components
- Box: Extends from Q1 to Q3. It captures the middle half of your data.
- Median Line: A bar inside the box marking Q2. Off-center medians show skew.
- Whiskers: Lines stretching to the smallest and largest values within 1.5×IQR.
- Outliers: Individual points beyond the whiskers, often plotted as circles or stars.
Helpful Enhancements
- Notches: Indicate a confidence interval around the median for comparing groups.
- Mean Marker: Some plots add a dot for the average to highlight asymmetry.
- Jittered Points: Overlaid scatter points reveal density without hiding the box.
- Color Encoding: Tailwind-powered palettes in PlotNerd distinguish categories.
When you understand what each mark conveys, you can extend the box plot to multiple categories and still decode the story instantly.
3. Step-by-Step: Reading Your First Box Plot
- Scan the median: Note whether the median line sits high or low inside the box. A higher median suggests most values lean upward.
- Compare box lengths: A wide box means a large IQR, signaling variability in the central 50%.
- Check whisker symmetry: Longer whiskers on one side reveal skewness in the tails.
- Inspect outliers: Dots outside extend your narrative — are they valid signals or measurement noise?
- Place it in context: If you have multiple boxes, compare medians and IQRs to see which group has more dispersion or higher typical values.
Following this sequence keeps your interpretation consistent, whether you are explaining grades, delivery times, or sensor readings.
4. Worked Example with Real Data
Suppose you collect weekly assignment scores from a class of 24 students. After loading the numbers into PlotNerd's Quartile Calculator, you obtain the following five-number summary using the R-7 algorithm:
| Statistic | Value | Interpretation |
|---|---|---|
| Minimum | 58 | Lowest score recorded that week. |
| Q1 | 72 | 25% of students scored 72 or below. |
| Median | 81 | Half the class scored 81 or less. |
| Q3 | 88 | Top-performing quartile begins here. |
| Maximum | 96 | Highest score in the dataset. |
The IQR equals 16 points (88 − 72). PlotNerd automatically draws whiskers to 72 − 1.5×16 = 48 on the low side and 88 + 1.5×16 = 112 on the high side. Because all observed values fall inside that range, no individual points are flagged as outliers. If a single student scored 39, PlotNerd would highlight the dot to show the instructor a potential retention issue.
Try it yourself: Create this exact box plot with the sample data below using PlotNerd's calculator.
Export the SVG straight from PlotNerd and embed it in your report, and stakeholders instantly understand how many students cluster near the top while one quarter still needs support.
5. Outliers, Whiskers, and the 1.5×IQR Rule
The classic Tukey rule defines outliers as any points beyond 1.5 times the IQR from the quartiles. Why 1.5? It balances sensitivity and robustness: you catch unusual values without flagging every legitimate extreme. Some fields stretch the multiplier to 3.0 for "far" outliers, especially in industrial quality control.
Tip
Toggle the algorithm switch inside PlotNerd to see how Tukey Hinges and R-7 change Q1/Q3. A narrower IQR under Tukey can reclassify borderline points as outliers — a useful check when reconciling reports across teams.
Experiment with algorithms: See how different quartile methods affect outlier detection.
🔄 Compare Algorithms Side-by-Side6. Classroom & Business Use Cases
Education: Teachers monitor grade dispersion, identify students needing intervention, and compare cohorts year over year. Pro tip: Use PlotNerd's multi-algorithm calculator to compare multiple classes side-by-side in one chart.
Operations: Logistics managers track delivery durations; a tight IQR means customers experience consistent timing.
Healthcare: Clinicians evaluate lab turnaround times; outliers could reveal staffing shortages or equipment issues. Advanced: For skewed medical data, try MAD outlier detection instead of the standard Tukey method.
Product Analytics: SaaS teams analyze feature adoption metrics, comparing the IQR of daily active minutes across segments. Visualization: Enable notched box plots to see if differences between groups are statistically significant.
7. Common Mistakes to Avoid
- Confusing mean and median: Remember the box centers on the median; the mean may sit elsewhere if the distribution skews.
- Ignoring sample size: A box plot derived from five values is fragile—display the count to maintain transparency.
- Overlooking context: An outlier might reflect a new market opportunity or a data entry error. Investigate before pruning.
- Comparing different algorithms: Hand off a chart with the algorithm noted. Align on R-7 vs Tukey using the quartile compatibility guide or explore all methods interactively with our Interactive Quartile Guide.
❓ Frequently Asked Questions
Q: What's the difference between a box plot and a histogram?
A: A histogram shows the full distribution with bars, while a box plot condenses the data into five key numbers (min, Q1, median, Q3, max). Box plots are better for comparing multiple groups quickly, while histograms show detailed shape information.
Q: How do I know if an outlier is significant or just an error?
A: Outliers flagged by the 1.5×IQR rule are worth investigating, but they may represent valid extreme values (e.g., a top performer) or data entry errors. Always check the raw data and context before removing outliers.
Q: Can I compare box plots from different sample sizes?
A: Yes, but be cautious. Box plots normalize for the middle 50% (IQR), so they're relatively robust to sample size differences. However, small samples (n < 10) produce less reliable quartiles.
Q: Why do some software programs show different quartiles?
A: Different algorithms (Tukey Hinges, R-7, Excel methods) calculate quartiles differently. PlotNerd supports multiple methods so you can match your software's approach. See our quartile compatibility guide for details, or use our Interactive Quartile Guide to compare all methods side-by-side with your own data.
Q: How do I read a box plot when there are multiple groups?
A: Compare medians (box center lines) to see which group has higher typical values. Compare IQR widths (box lengths) to assess variability. Look for overlapping boxes vs. separated boxes to understand group differences.
Q: Can I use box plots for categorical data?
A: No, box plots require numerical data. For categorical data, use bar charts or pie charts. Box plots are designed for continuous numerical variables like scores, measurements, or counts.
8. Practice with PlotNerd and Keep Learning
Ready to build your own chart? Paste data into the PlotNerd calculator, switch between Tukey Hinges and R-7, and export polished visuals in seconds. Our engine keeps calculations client-side, so classroom datasets and business metrics stay private.
Try PlotNerd Today
Generate a box plot, compare quartile methods, and share accurate visuals with your team.
Launch the Box Plot CalculatorKeep expanding your statistical toolkit with our curated resources:
- How to Compare Multiple Groups with Grouped Box Plots – learn to compare multiple data groups side-by-side in a single chart.
- MAD vs Tukey: Choosing the Right Outlier Detection Method – compare outlier detection methods for different data distributions.
- Understanding Notched Box Plots – visualize statistical significance with median confidence intervals.
- Box Plot in Excel (2026) — Step-by-Step Guide – create professional box plots in Excel with detailed instructions.
- Why Are There So Many Quartile Methods? A Deep Dive into Tukey's Hinges – understand the history and philosophy behind quartile calculation methods.
- Tukey's Hinges vs. R-7 Quantiles – compare different quartile algorithms and learn when to use each.
- Interactive Guide to Quartile Calculation Discrepancies – compare all quartile methods (Tukey, R-7, Excel, WolframAlpha) with your own data and see step-by-step calculations
🛠️ Related Tools
- IQR Outlier Detector – detect outliers using Tukey and MAD methods with instant visualization
- Tukey Hinges Calculator – calculate quartiles and create box plots with multiple algorithm support
- Interactive Quartile Guide – explore quartile method differences with visual step-by-step calculations